This is for show casing some exploratory design for visualizations I've been researching on around key use cases for SIEM. SIEM has proactively adopted visualizations in order to provide summary of massive data, surface patterns and abnormalities, and some vendors introduced advanced visualization tools where analysts can get their answers.
I have been always fascinated by the functional beauty and fascinating insights creative visualizations can bring to the product experience. Some of my projects involved some visualization features, but the depth of them were not very deeply requests, so I determined to spend some of my time to explore this exciting visualizations as my personal projects and here are some of the results I've made.
IDENTIFYING ANOMALIEIS AND PATTERNS:
Through visualizations, hidden patterns and outliers in vast datasets become apparent, enabling analysts to swiftly pinpoint potential threats.
Understanding Multiple Dimensions:
Visualizations provide a comprehensive view of security events by illustrating the timeline, relationships, and context in which incidents occur. This multidimensional approach, incorporating time, relational dynamics, and quantitative metrics, offers a deeper insight into the nature of security threats and their implications.
Data ingestion monitoring in cybersecurity systems is a critical process that involves tracking, managing, and analyzing the flow of data from various sources. This process is essential for ensuring the system can effectively perform its core functions. In my design exercises, I've investigated two kinds of data visualizations
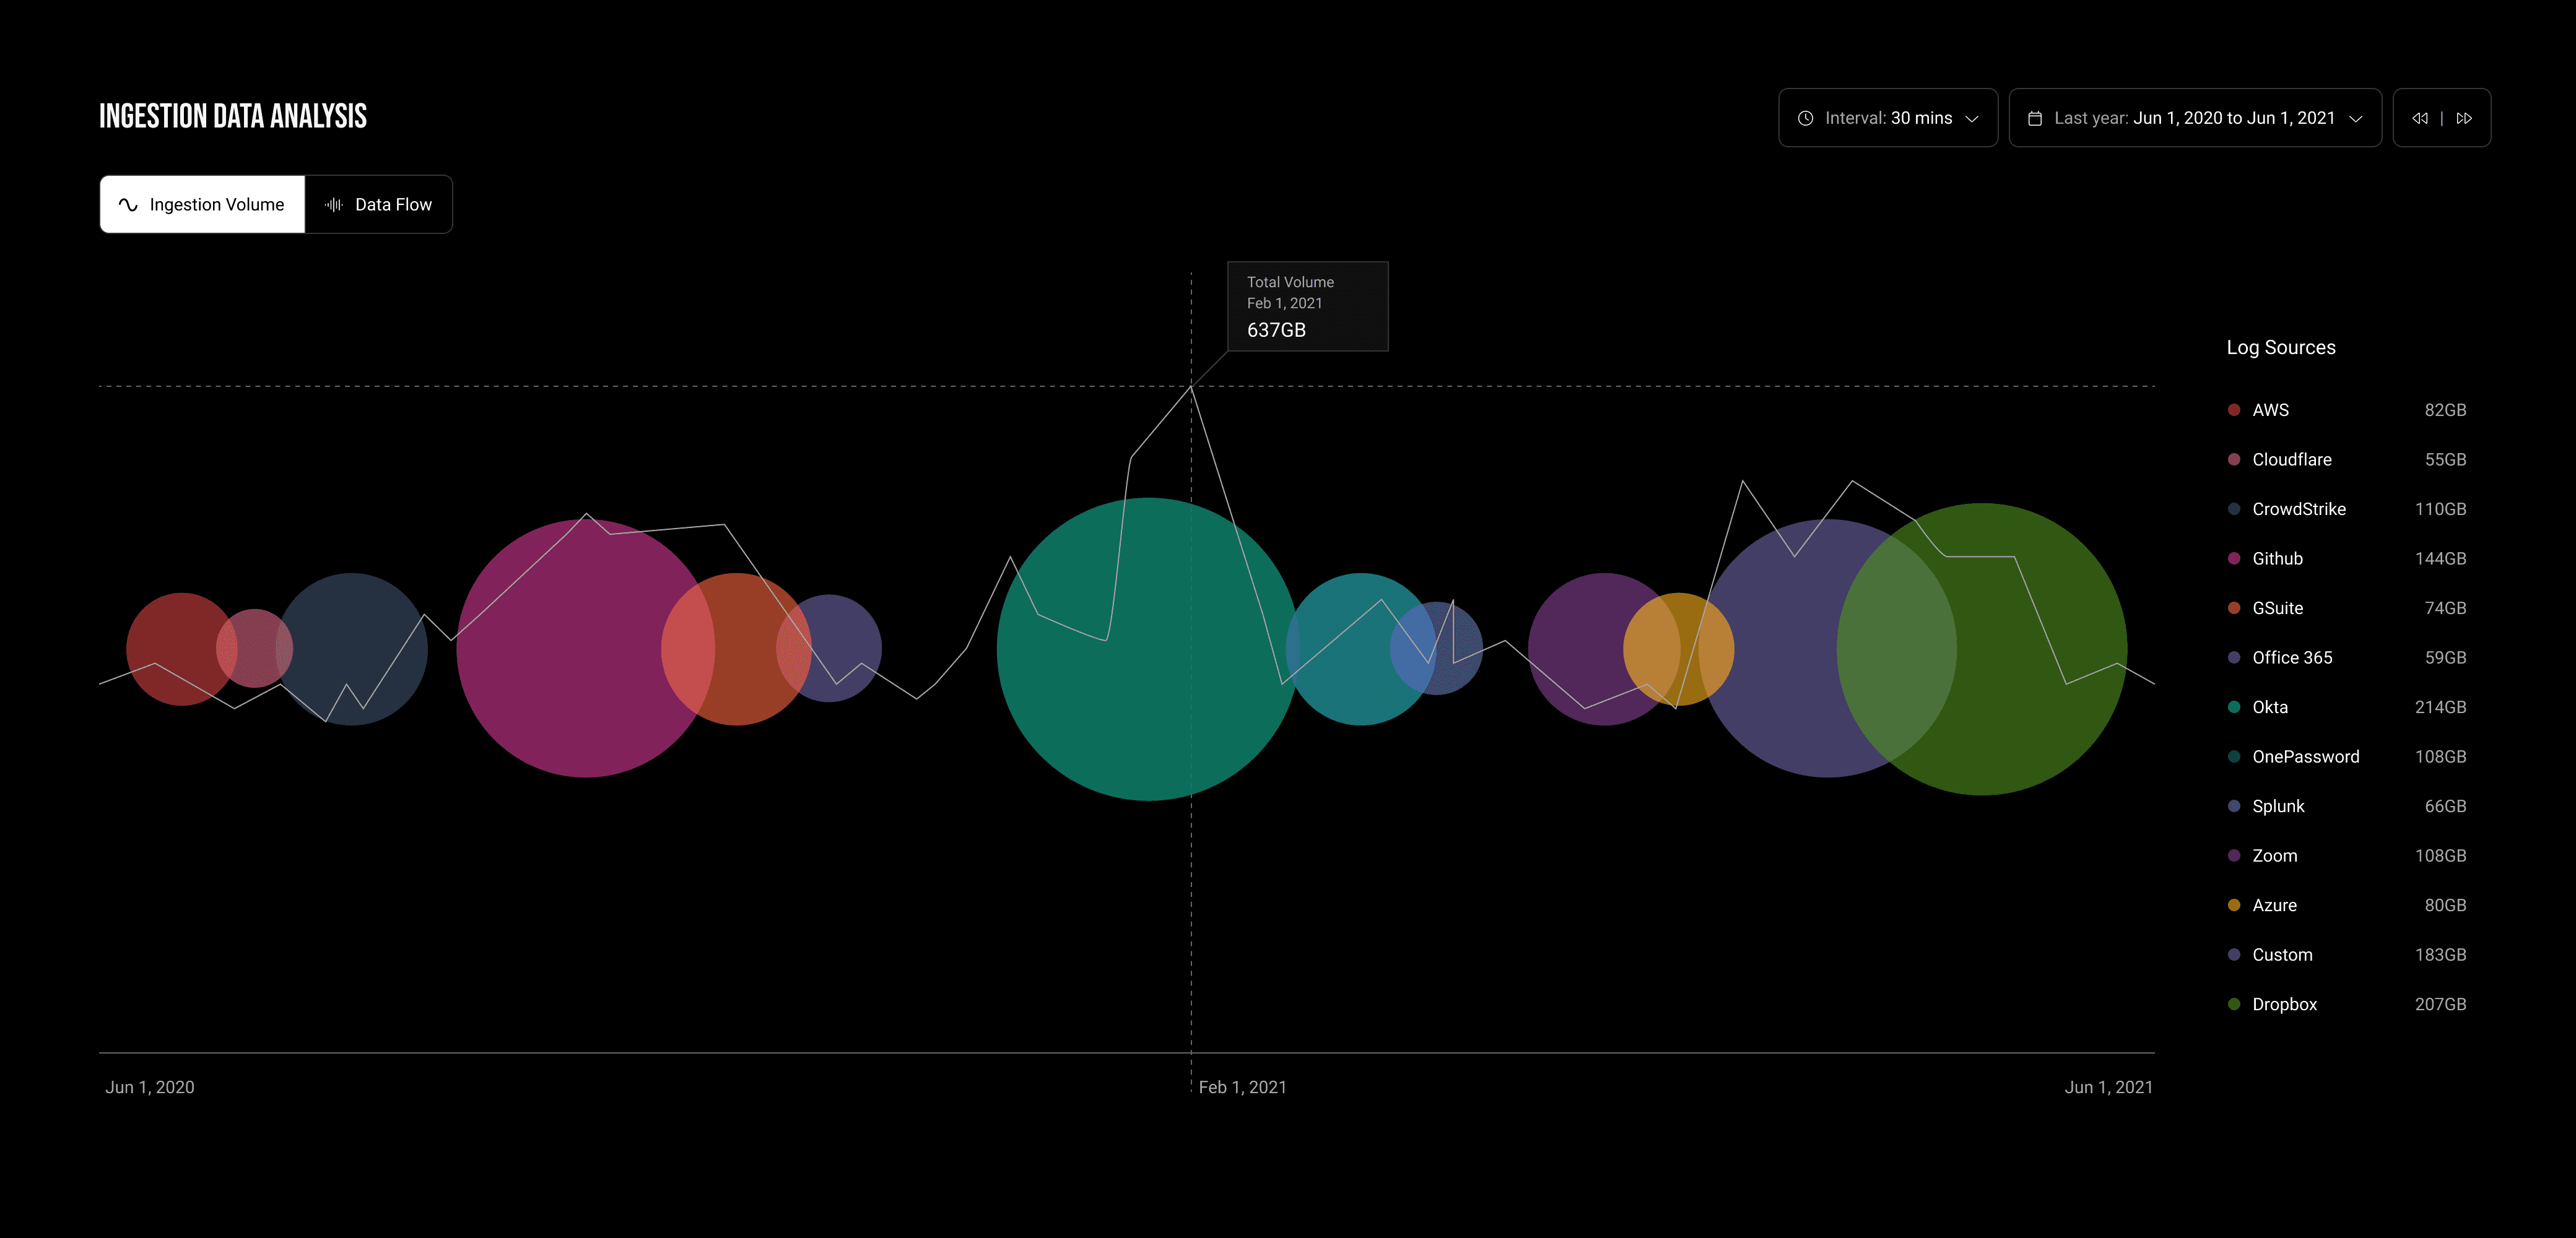
Ingestion Volumes Over Time by Data Sources:
This visualization tracks the volume of data ingested over time from various sources, identifying trends, peak data influx periods, and potential data collection inconsistencies.

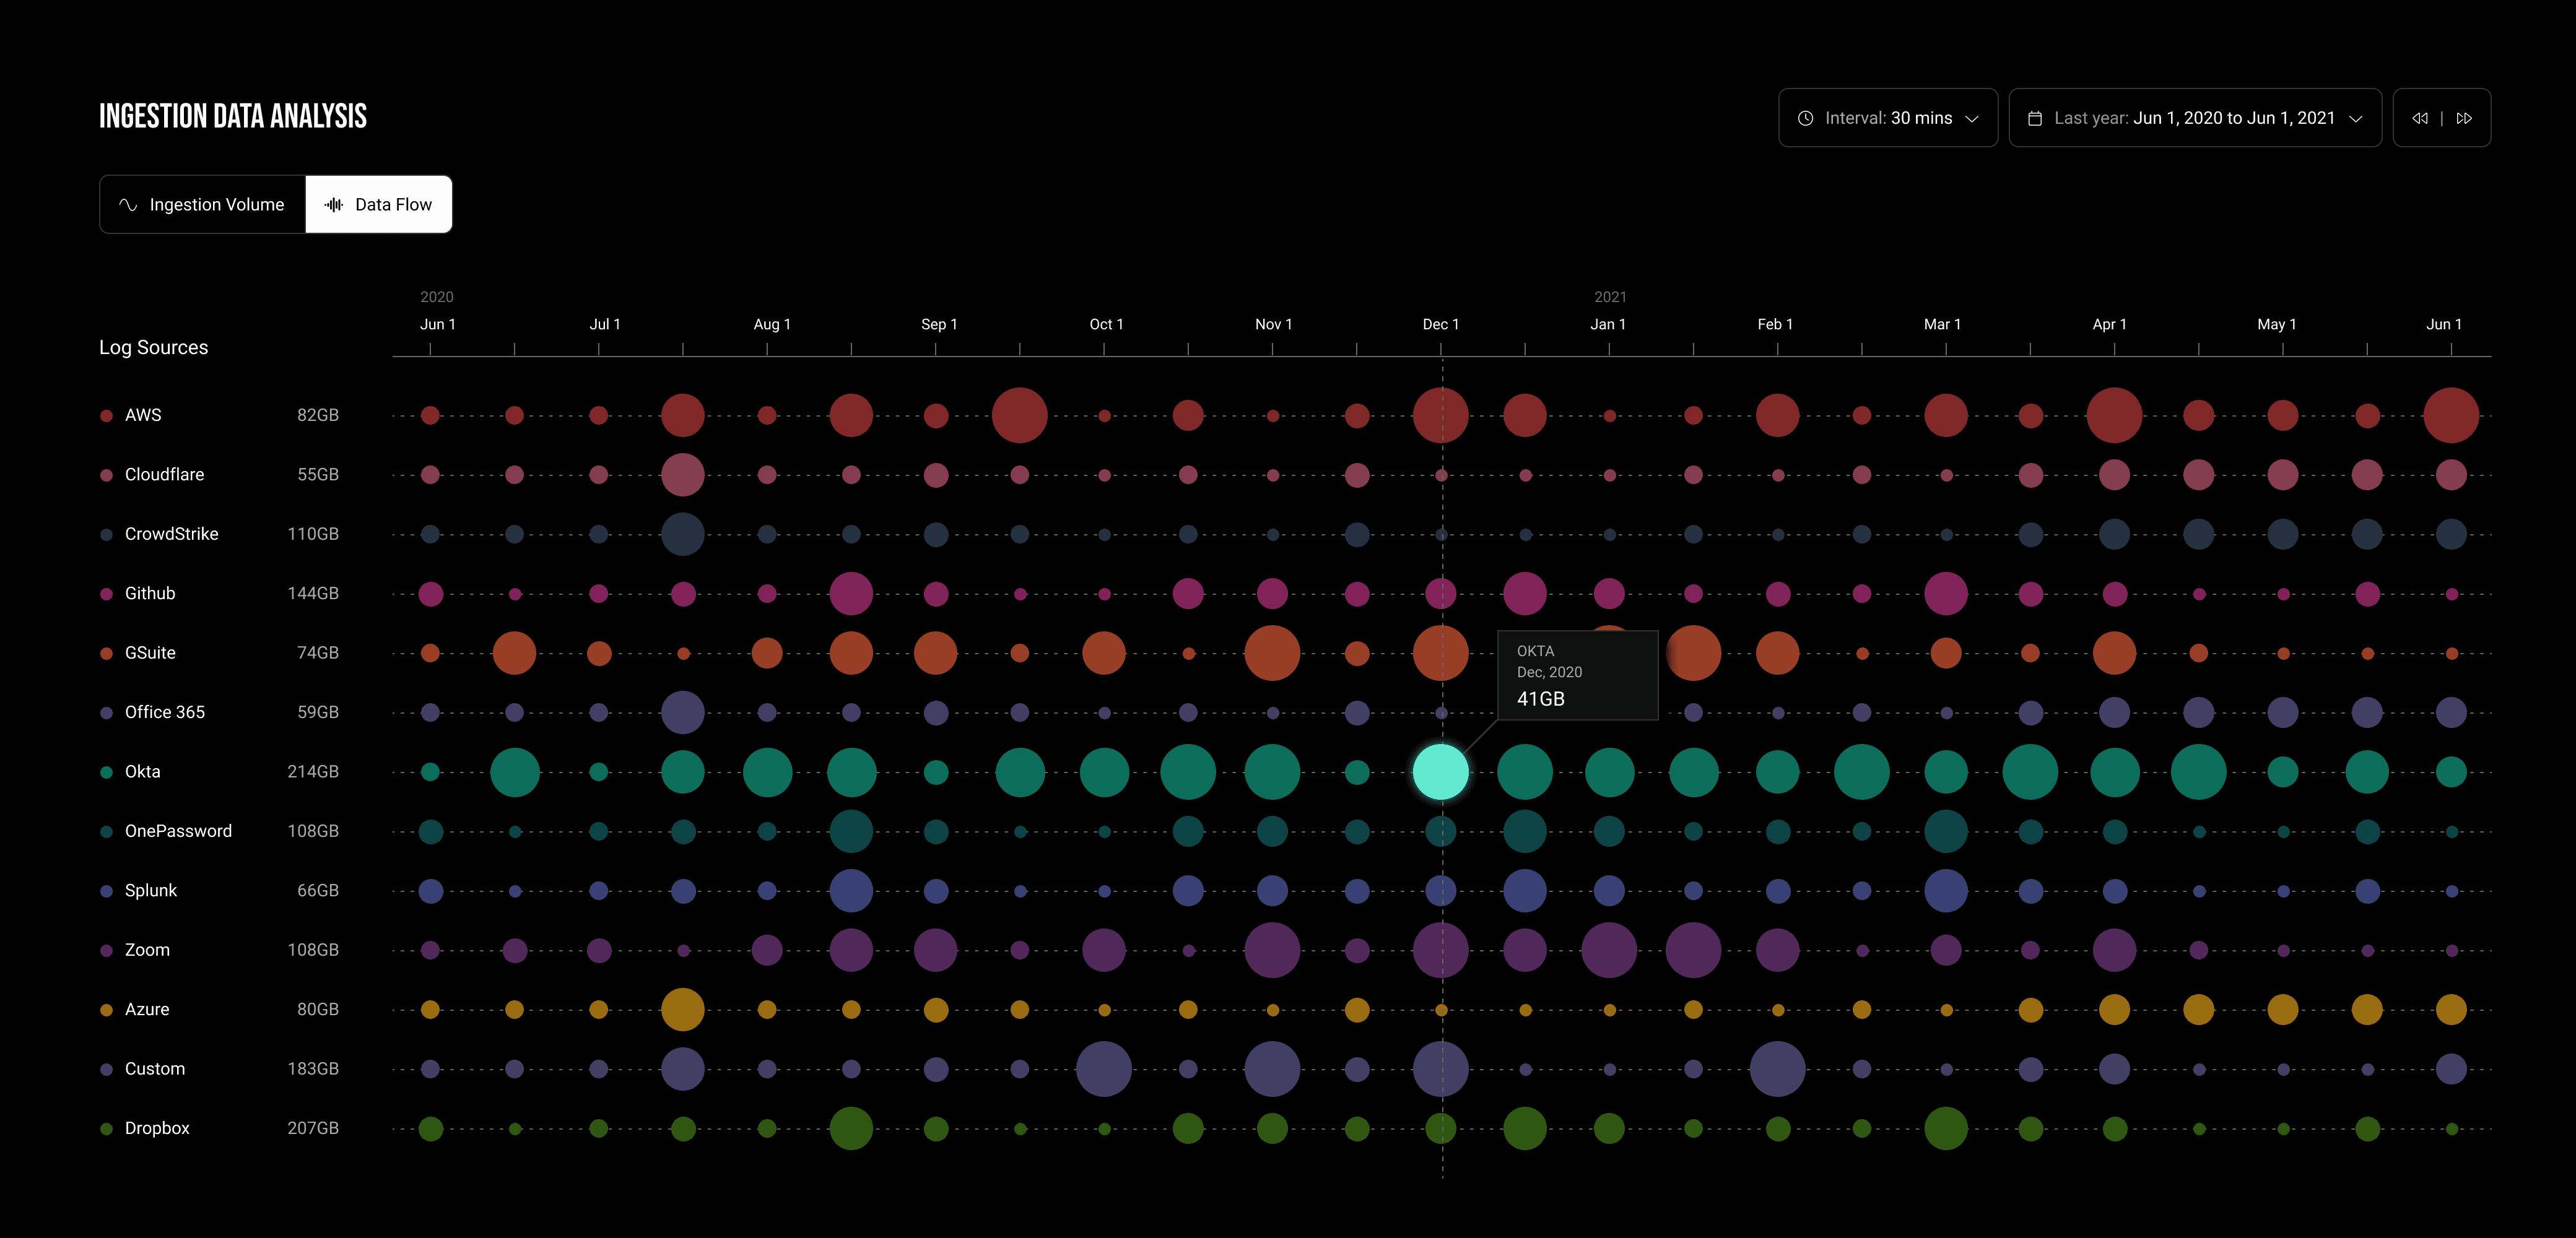
Ingestion Flows by Data Sources:
Utilizing a bubble timeline, I was able to delineate the journey of data ingestion across the system, segmented by log types over time. This vibrant chart not only showcases the status of data ingestion but also highlights the fluctuations in data volume entering the system over time. It provides analysts with a visual representation of when and where data influx from each log source might increase or decrease.
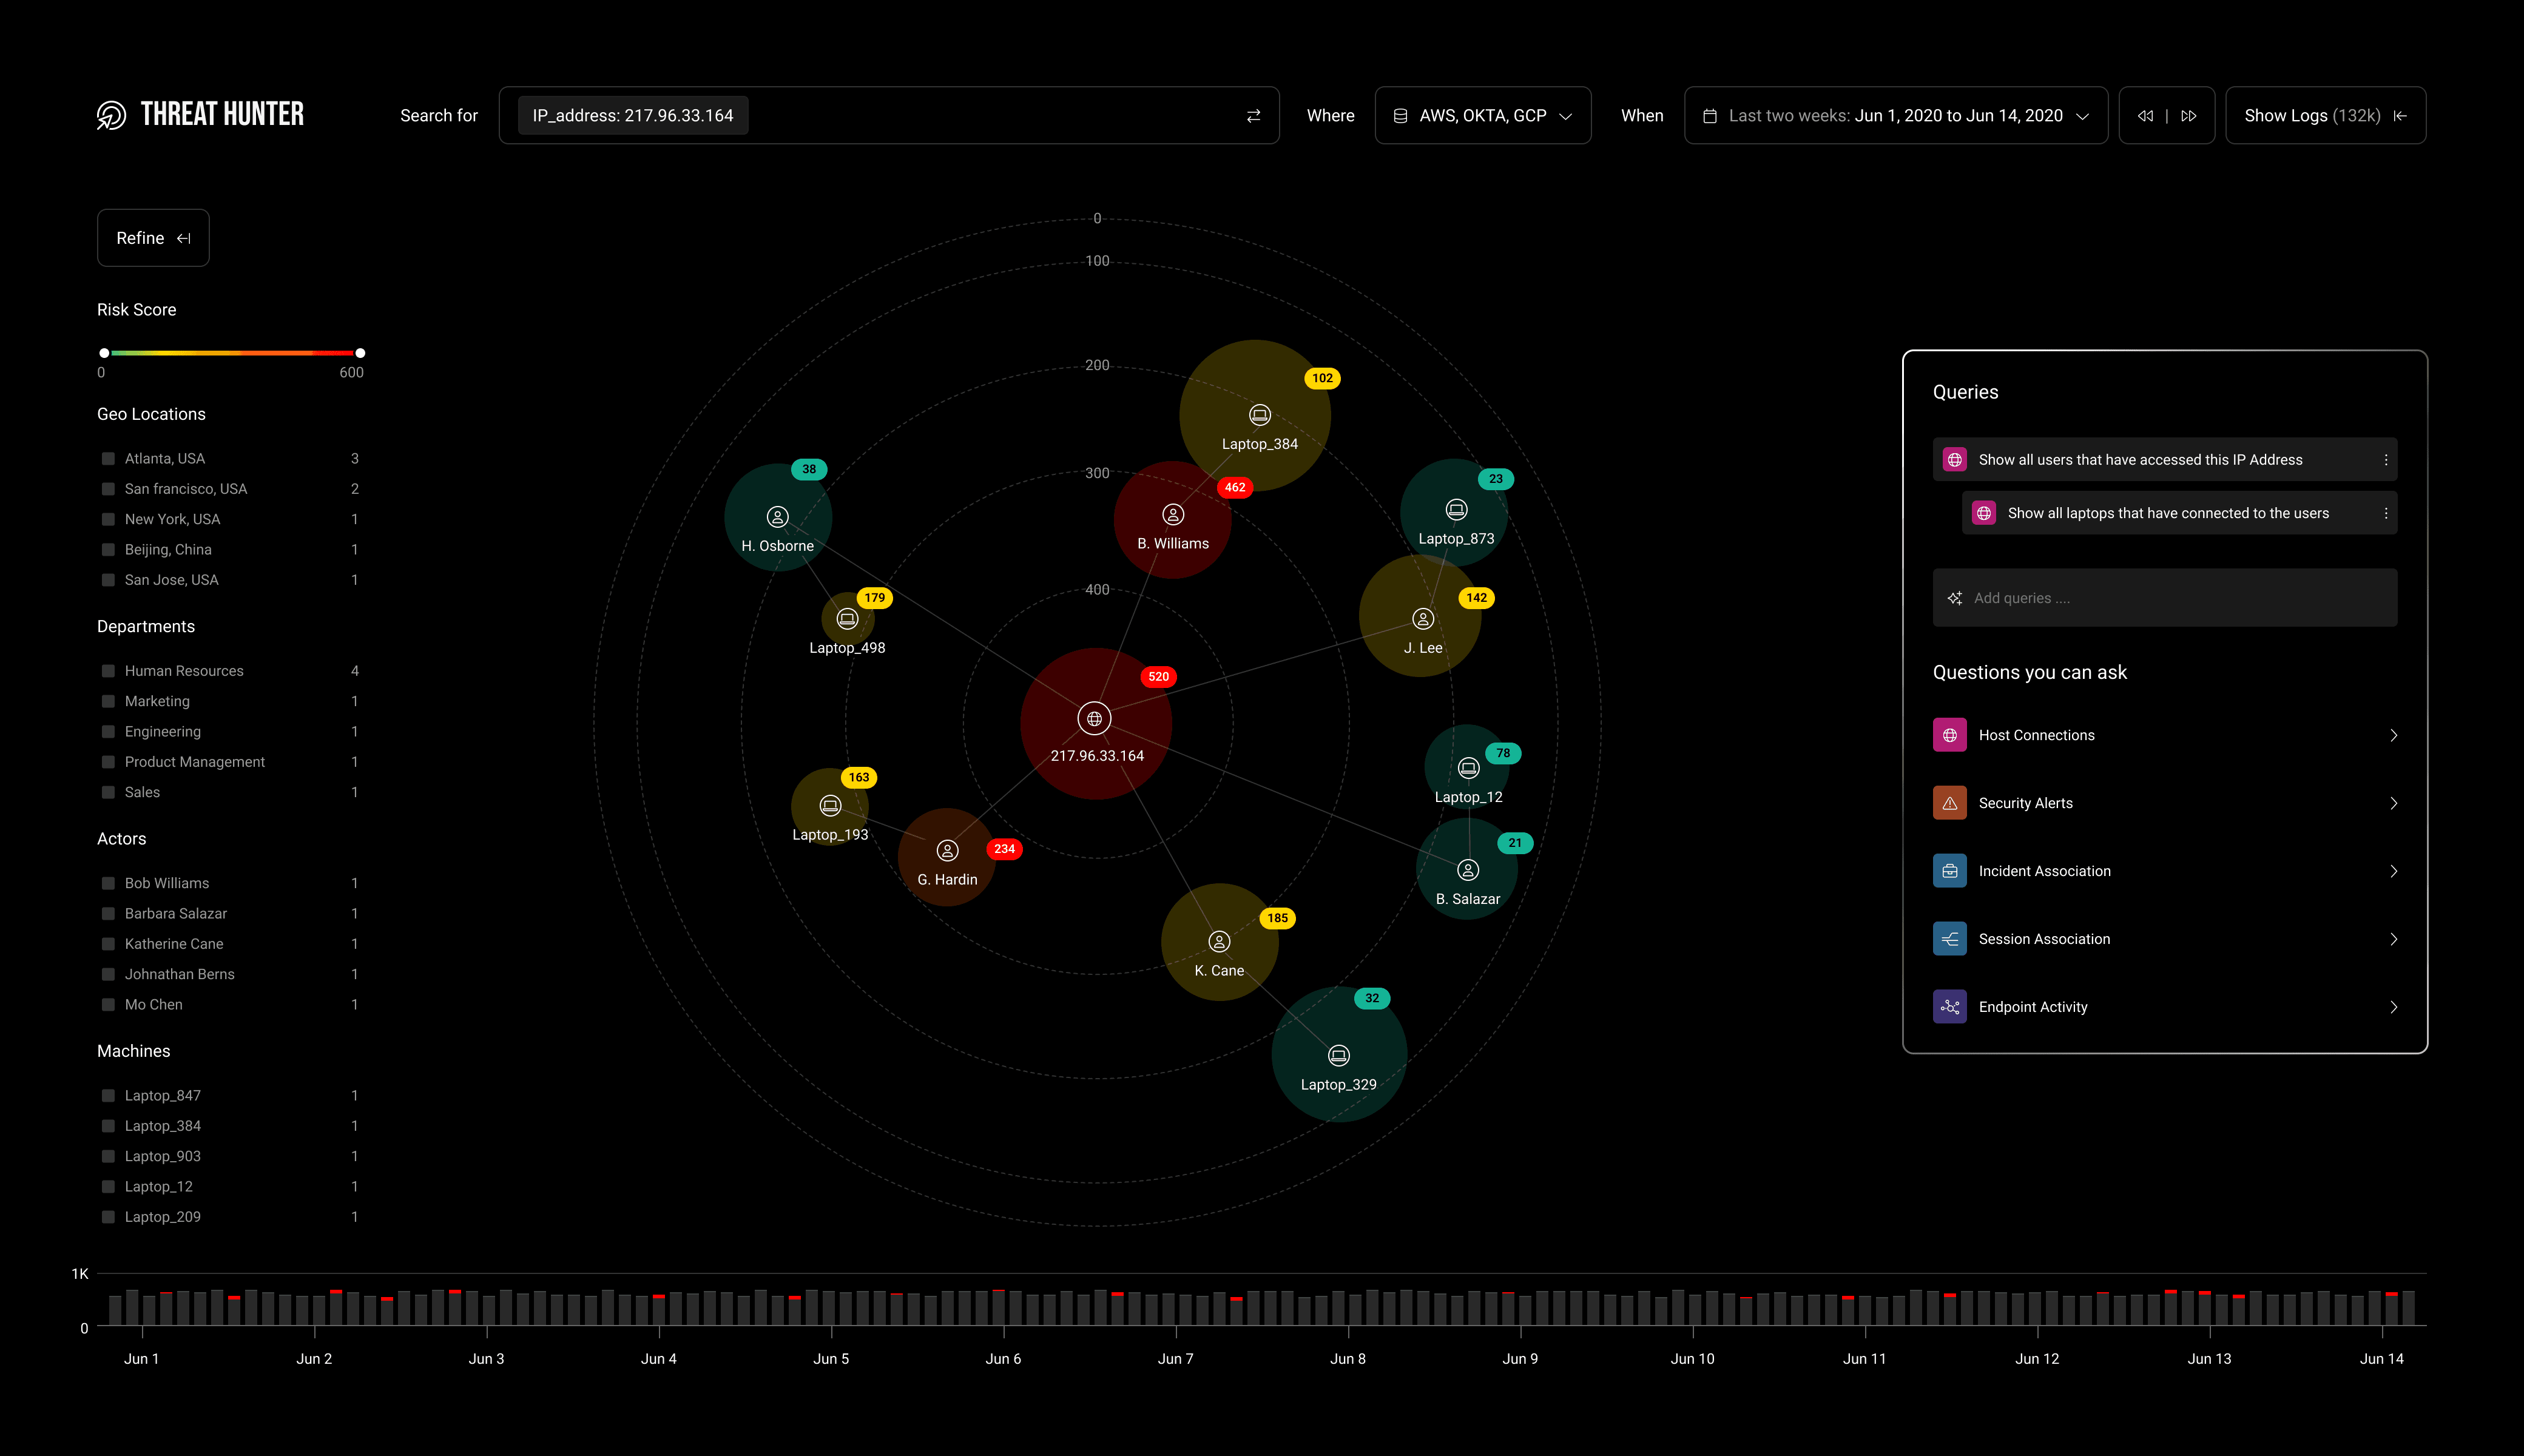
In cybersecurity investigations, it's vital to unravel the attack chain to comprehend the methods attackers used to breach a system. Analyzing the interconnections between entities serves as a key strategy for detection.
Consider this illustration: during the probe of a phishing attack, analysts construct and visualize a network of interactions within the organization, capturing the interactions among multiple users and assets. This is achieved through an interactive linear flowchart, effectively mapping out the attack's touchpoints.
The right-hand query panel is a dynamic tool, enabling analysts to construct and delve deeper into these connections. It offers a robust, step-by-step means to flesh out the network, fostering a comprehensive understanding of the attack's scope and reach. This interactive mechanism is not only about tracing the attack's lineage but also about equipping the investigative team with the means to widen their analysis, exploring connections that extend the narrative of the breach.
This interactive analysis tool exemplifies how visual aids in cybersecurity can transform raw data into a comprehensible story, enabling swift action and informed decision-making in the face of complex threats.